Household Affordability remains constrained by high prices, housing costs and debt service
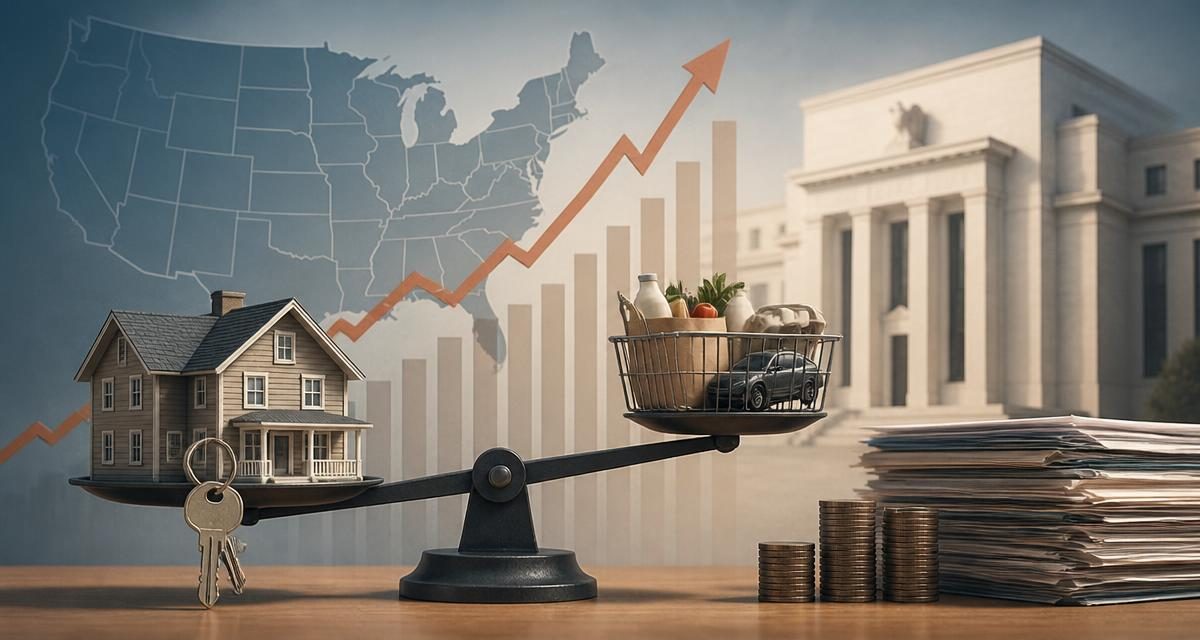
The cumulative CPI baseline remains essential: lower current inflation would mean prices rise more slowly, not that the prior 21.4% national price-level increase disappeared.
The burden is uneven
Renters, first-time buyers, lower-income families and highly indebted households face the greatest burden. Regional housing, insurance and utility costs vary widely.
The inherited price-level baseline
The required BLS baseline shows a 21.4% cumulative CPI-U increase from January 2021 to January 2025. That is an index calculation, not a causal assignment to one president.
Price-reduction channels and offsets
The administration is pursuing energy supply, deregulation, permitting, drug-price, competition, anti-fraud and trade measures. Tariffs can also raise imported consumer and producer costs.
The wages test
Purchasing power requires real wage and after-tax income gains, not nominal wage growth alone. Housing and credit costs can offset income improvement.
Measurement discipline
No new BLS or BEA release was verified inside the exact Sunday window. The next update should compare the latest CPI, earnings and disposable-income series with January 2025 and pre-2020 levels.
What improvement would look like
Families need sustained real-income growth, more housing supply, lower financing pressure and broad—not promotional—price relief.
What changed
No material new national affordability data release was verified in the exact 12-hour window; the standing CPI baseline remains 21.4% from January 2021 to January 2025 using the specified BLS values.
Why it matters
Families experience the cumulative price level, housing and debt-service burden rather than the inflation rate alone.
What to watch next
Next CPI, earnings, personal-income, mortgage and housing-cost releases.
What we know
- Using CPI-U all items, (317.671 / 261.582 - 1) × 100 equals about 21.4% cumulative price-level growth from January 2021 to January 2025.
- This national average does not mean every product or household expense rose 21.4%.
- Slower inflation does not reverse the cumulative increase.
- Current affordability depends on real income, housing tenure, region, household type and debt exposure.
Material unknowns
- Latest real-income distribution
- Regional housing and insurance changes
- Tariff pass-through
U.S. strategic assessment
Critical interestThe administration has multiple affordability channels, but some policies work slowly or create offsets.
Objectives
- Lower essential costs
- Raise real wages
- Expand housing and energy supply
- Reduce fraud and market distortions
Strategy
- Energy and permitting
- Competition enforcement
- Trade adjustment
- Tax and income policy
Outcomes
- No broad price-level reversal verified
- Outcome varies sharply by household
Risks
- Tariff pass-through
- Housing and insurance costs
- Energy shocks
- High consumer-credit rates
Sources
01Controls price index
Nominal and real earnings
Disposable-income measurement
Credit and monetary-policy transmission
Conservative policy analysis
Nonpartisan household and public-opinion research when methodologically relevant