GLOBAL
INTELLIGENCE REPORT
INTELLIGENCE REPORT
GIB · GLOBEINTELREPORT.COM
Latest headlines
Administration · 2026-10-15CEA publishes estimates for hypothetical immigration-policy changesAdministration · 2026-10-14Patient recruiter pleads guilty in unlawful opioid-distribution conspiracyAdministration · 2026-09-30VA reports record fiscal-year claims processingAdministration · 2026-10-15Workforce Pell guidance explains eligibility for short-term trainingAdministration · 2026-10-14September inflation accelerates as gasoline and shelter costs riseAdministration · 2026-10-14Treasury and IRS propose Premium Tax Credit verification rulesAdministration · 2026-10-14CMS removes subsidies tied to duplicate or deceased enrollment recordsAdministration · 2026-10-14Four Texas residents charged in alleged tax-shelter schemeAdministration · 2026-10-13HHS declares public-health emergencies for Florida and Alabama after Hurricane IsaiasAdministration · 2026-10-14HHS requests answers from medical organizations about procedures for minorsAdministration · 2026-10-14HHS launches voluntary healthy-lifestyle commitment for health centersAdministration · 2026-10-14Energy awards methane-hydrate research contract valued at up to $49.8 million
Economic Intelligence

Family prosperity, business strength, industrial renewal, macroeconomic performance, and Trump Administration policy results
Recovering Gulf oil flows and continuing household pressure
Focused evidence update · September 30, 2026
September 30 reporting points to a substantial recovery in Gulf oil exports, including resumed Saudi Red Sea loadings. Goldman Sachs’ preceding-week estimate was 23.3 million barrels per day, around its 2025 average; JPMorgan’s different 10-day measure was 20.5 million, or 89%. These estimates have different periods and must not be added together or described as pipeline capacity.
Improved crude supply can reduce disruption pressure, but it does not establish equal recovery in diesel, jet fuel or liquefied natural gas (LNG). The economic test remains delivered fuel, refining output, freight and insurance costs, and the prices households actually pay. A recovered export volume is not proof of immediate U.S. retail-price relief or a policy-caused decline.
CBO’s September 15 estimate places combat costs near $38 billion through August 1, with additional monthly costs dependent on intensity. War expenditure, munitions replacement and civilian hardship remain separate from gains in supply resilience. Qatar’s latest exchange of U.S. and Iranian terms has not produced a verified durable settlement.
October 3 follow-up: China’s Iranian-oil purchases connect regime revenue to energy trade. The economic test is actual delivered supply, freight and household fuel costs; the interview’s midterm framing does not establish an electoral outcome or immediate U.S. price relief. October 3 evidence and video
Read the full Iran/IRGC article
Sources: Reuters · September 30 export recovery and prices · CBO · September 15 combat-cost estimate · Reuters · September 30 Qatar mediation
Economic Intelligence / Measured Results
Signs of Economic Progress
During the Trump Administration · Latest available releases
An encouraging outlook, with clear tests ahead
The chart shows gains in jobs, manufacturing employment, disposable income and private domestic demand. The Trump administration is seeking to build on that momentum through deductions for qualifying tips and overtime, faster tax deductions for business investment, expanded domestic energy production and faster permitting. It is also using tariffs to encourage U.S. manufacturing and has proposed cuts to nondefense spending.
Those policies aim to raise take-home pay, expand production and ease costs over time. Higher energy prices, weaker inflation-adjusted hourly pay and federal borrowing remain obstacles. The outlook becomes stronger if household costs fall, announced investment turns into operating capacity, and fiscal savings materialize. The chart tracks economic conditions; it does not establish how much of the improvement these policies caused.
Measured results: BLS August employment ↗ · BEA July income ↗ · BEA Q2 private domestic demand ↗. Policy record: IRS tax provisions ↗ · Energy policy ↗ · Tariff action ↗ · FY2027 budget proposal ↗. Measures use different units and periods.
Examine whether economic policies are improving household purchasing power and productive capacity, and at what fiscal cost. The dashboards below remain the live monitoring record.
Open the investigation →Economy sections
Prosperity Measured from the Household to the Factory Floor
Conservative policy objectives are evaluated against implementation, current data, distributional effects, and independently measurable results.
Treasury economic strategy
Trade · Tax · Deregulation
Secretary Bessent identified these as three pillars of the administration’s economic agenda. Each is measured against an observed outcome, with implementation and household or fiscal costs checked separately.
01 · Trade
Success measure: Sustained growth in real U.S. manufacturing output, alongside implemented market access and exports.
Check: Compare with pre-policy output, import prices, retaliation and household costs; tariff collections alone are not success.
Federal Reserve output data ↗Trade coverage →02 · Tax
Success measure: Rising real disposable income per person, assessed by income group and household type as data permit.
Check: Compare tax relief and investment with CBO’s deficit and debt effects; a larger refund alone can reflect withholding.
BEA income data ↗Household coverage →03 · Deregulation
Success measure: Shorter completed federal permitting timelines and realized productive investment, compared with the pre-change baseline.
Check: Verify final rules and actual project completion; track safety and environmental outcomes rather than count repealed rules.
Permitting Council data ↗Business coverage →Measurement framework; no pillar receives a success score until dated baseline, current value, implementation status and attribution limits are documented. Treasury’s March 30, 2026 statement ↗
Economy dashboard
Economic Progress vs. Current Risk
38measures reviewed
6 measured · 21 partial · 5 evidence gaps · 6 conditional. “Reviewed” counts evidence decisions, including unresolved items; it is not a progress or truth score.
Each item identifies a dated observation, its comparison, an evidence limit and a primary source. Measured means a defined indicator has a comparison; partial means only part of the named measure can be checked; conditional means a legislative scenario rather than an observed result. Direction describes the indicator, not the administration's causal impact. Open any item for its basis.
Public evidence reviewed through September 26, 2026. This review is separate from the saved GIB edition (brief cutoff unavailable); dates vary by source. No aggregate economic progress score is computed because measures have different units and unresolved outcomes.
Administration objectives and evidence tests
The administration states goals of lower family costs, tax relief, stronger domestic production, energy abundance, and more reciprocal trade. The data below test outcomes without treating a policy announcement as a measured gain. White House economy priorities ↗
Family prosperity: Compare price levels and real after-tax income with household spending, regional prices, and debt stress.
Industry and jobs: Compare announced investments with actual capital spending, business openings and closures, payrolls, productivity, and output.
Energy and trade: Compare production and agreements with state electricity costs, product-level trade flows, and completed domestic capacity.
Fiscal results: Compare stated tax and spending aims with enacted provisions, Treasury receipts and outlays, and CBO projections.
Family & Household Economy
Measures whether growth is reaching families after taxes, inflation, borrowing costs, and unavoidable recurring expenses.
Biden-era price-level baselineMeasured · Rising
CPI-U was 261.582 in January 2021, 317.671 in January 2025 and 334.980 in August 2026: roughly +21.4% across the first interval and +5.5% since January 2025.
Limit: Unadjusted index-level comparisons are not annual inflation rates or presidential causal estimates.
Aug 2026 · BLS historical CPI-U ↗Housing, rent & mortgagesPartial · Rising
The 30-year mortgage average was 7.03% on September 24, up from 6.95% a week earlier and 6.30% a year earlier; August shelter CPI rose 3.0% year over year. BEA's latest regional prices show substantial differences in housing-rent levels across states.
Limit: Mortgage and CPI rates do not capture property taxes, insurance or local rent burdens; BEA regional price levels are annual and currently refer to 2024.
Sep 24 / Aug 2026; regional 2024 · Freddie Mac PMMS ↗ · BEA regional price parities ↗Food, retail & servicesMeasured · Rising
August food CPI rose 2.7% year over year; grocery prices rose 2.2%, food away from home 3.4%. Retail and food-service sales rose 1.2% in August. BLS consumer-expenditure tables allow spending-basket comparisons by income and household composition.
Limit: Retail sales are nominal and do not prove rising real volumes; expenditure breakdowns currently lag 2026 conditions.
Aug 2026; household tables 2024 · BLS CPI ↗ · BLS consumer expenditures ↗Energy & transportationMeasured · Rising
August energy CPI rose 16.3% year over year, gasoline 27.4%; energy rose 2.1% from July. EIA's July electricity tables separately report residential, commercial and industrial prices by state.
Limit: National CPI does not establish each household's bill or local fuel prices; EIA's average electricity price is not the total bill.
Aug CPI / Jul EIA 2026 · BLS CPI ↗ · EIA state electricity prices ↗Healthcare & prescriptionsPartial · Mixed
August medical-care services CPI fell 0.2% from July but rose 2.5% over 12 months; medical-care commodities fell 2.7% over 12 months.
Limit: CPI components are not a complete out-of-pocket, premium, deductible and prescription basket.
Aug 2026 · BLS CPI ↗Childcare & educationPartial · Unresolved
The August CPI release records an increase in the education index during the month.
Limit: A comparable national childcare-bill series and household-type cost baseline were not verified in this review; no joint affordability direction is assigned.
Aug 2026 · BLS CPI ↗Nominal vs. real wagesMeasured · Mixed
Real average hourly earnings fell 0.1% from July to August and 0.3% year over year, while real weekly earnings rose 0.3% year over year as hours increased.
Limit: Averages mask occupation, income group and household differences.
Aug 2026 · BLS real earnings ↗Disposable income & purchasing powerMeasured · Rising
Real disposable personal income rose 0.4% in July from June; current-dollar disposable income rose 0.5%.
Limit: This is an aggregate monthly change, not a finding that every household gained purchasing power.
Jul 2026 · BEA personal income ↗Taxes, credit & debt servicePartial · Mixed
BEA reports July disposable income after personal taxes rose 0.5% in current dollars. New York Fed data show total household debt fell $13 billion in Q2 to $18.8 trillion, while credit-card balances rose $21 billion from Q1.
Limit: Balances are not payment burdens; no combined after-tax, interest-payment and debt-service result by household is established.
Jul income / Q2 debt 2026 · BEA personal income ↗ · New York Fed household debt ↗Income, household & regional gapsPartial · Unresolved
Census reports real 2025 median household income of $87,460, up 2.6% from 2024. The Census household pulse series provides separate, more timely reports of difficulty paying usual expenses.
Limit: The annual median does not establish 2026 gains by family, tenure or region; pulse responses are self-reported and survey designs changed in 2026.
2025 income / 2026 pulse methodology · Census income release ↗ · Census household pulse ↗
Business & Industry
Tests whether policy is producing durable private activity, productive capacity, competitive costs, and quality employment.
GDP, demand & productivityPartial · Mixed
Real GDP grew at a 1.5% annual rate in Q2 versus 2.1% in Q1; real final sales to private domestic purchasers grew 4.2% in Q2. BLS separately publishes manufacturing output per hour for a productivity test.
Limit: GDP growth, underlying demand and output per hour answer different questions; no productivity effect is attributed to a particular policy.
Q2 2026 · BEA GDP ↗ · BLS manufacturing productivity ↗Small-business formation & closuresPartial · Mixed
August business applications were 531,728, down 7.8% from July; projected formations within four quarters were 28,501, down 4.6%. Census Business Dynamics Statistics tracks actual firm startups and shutdowns.
Limit: Applications and projected formations are not actual openings; the latest BDS firm series is annual and currently ends in 2023, so it cannot settle 2026 closures.
Aug 2026 applications / BDS through 2023 · Census business formation ↗ · Census business dynamics ↗Sales, margins & input costsPartial · Mixed
August nominal retail and food-service sales rose 1.2% from July; final-demand producer prices rose 0.4% in August and 5.4% over 12 months.
Limit: These series do not reveal an economy-wide realized business-margin trend.
Aug 2026 · Census retail sales ↗ · BLS PPI ↗Supplier price cuts & durationEvidence gap · Unresolved
Producer prices rose 0.4% in August; isolated announced discounts do not demonstrate broad, sustained supplier cuts.
Limit: A matched product/supplier panel with before-and-after transaction prices and duration was not verified.
Aug 2026 · BLS PPI ↗Credit, rates & bankruptciesPartial · Rising
The FOMC raised the funds-rate target to 3.75–4.00% on September 16.
Limit: The policy rate is not an observed small-business borrowing rate; no matched credit-access and bankruptcy series was reconciled.
Sep 16, 2026 · Federal Reserve FOMC ↗Manufacturing & reshoringPartial · Mixed
Manufacturing output fell 0.3% in August after seven monthly gains and stood 0.9% above a year earlier.
Limit: Domestic output does not by itself measure reshored supply chains or causal effects of trade policy.
Aug 2026 · Federal Reserve G.17 ↗Capital spent vs. announcedPartial · Unresolved
BEA reports investment contributed to Q2 GDP growth; the Fed reports August business-equipment output fell 0.5%. Census's Annual Integrated Economic Survey supplies industry-level capital-spending estimates for 2023 and 2024.
Limit: Historical industry totals do not verify any 2026 project announcement, completion or cash outlay; the new Census capital-spending product is experimental.
Q2 / Aug 2026; AIES 2023–24 · BEA GDP ↗ · Census capital expenditures ↗Payroll jobs, real pay & workforceMeasured · Mixed
Payrolls rose 162,000 in August; unemployment was 4.1%. Real hourly earnings fell 0.3% year over year, while real weekly earnings rose 0.3%. BLS employer records allow a separate industry and county cross-check of employment and wages.
Limit: Payroll and household surveys differ; QCEW coverage is broad but arrives with a lag and cannot isolate policy effects.
Aug payrolls / Q1 QCEW 2026 · BLS employment situation ↗ · BLS county wages and jobs ↗Factory construction vs. outputPartial · Unresolved
July construction spending was 3.8% below July 2025 overall; August manufacturing output fell 0.3% from July.
Limit: All-construction spending is not factory-specific; no matched factory completion-to-output cohort was established.
Jul / Aug 2026 · Census construction spending ↗ · Federal Reserve G.17 ↗Energy, infrastructure & supply chainsPartial · Mixed
August mining output rose 0.1%, utilities output rose 1.8%, and manufacturing output fell 0.3%. EIA publishes state electricity prices by residential, commercial and industrial use.
Limit: Production and average prices do not establish reliability, full household bills or supply-chain resilience.
Aug output / Jul electricity 2026 · Federal Reserve G.17 ↗ · EIA state electricity prices ↗
Trump Economic Agenda
Separates the administration's stated objectives and legal actions from implementation, measured results, offsets, and unresolved constraints.
Retailer & supplier price pressurePartial · Unresolved
Food CPI rose 2.7% and final-demand PPI rose 5.4% over the year to August.
Limit: A request to lower prices cannot be credited with a measured national discount absent matched transaction data and controls.
Aug 2026 · BLS CPI ↗Competition & personalized pricingEvidence gap · Unresolved
No verified national outcome series connects competition or personalized-pricing actions to a lower household basket in this review.
Limit: Requires dated rule/enforcement records and matched consumer-price evidence.
Sep 26, 2026 review · Federal Trade Commission ↗Tax and spending policyPartial · Unresolved
CBO projects a $1.9 trillion FY2026 deficit and debt rising to 120% of GDP by 2036 under its February baseline. Treasury's monthly statement records realized receipts, outlays and deficit for a separate fiscal check.
Limit: Baseline projections and aggregate cash results do not identify the effect of each enacted tax or spending provision; bill-specific scoring remains necessary.
Feb 2026 projection / monthly Treasury series · CBO budget outlook ↗ · Treasury monthly statement ↗Deregulation & permittingEvidence gap · Unresolved
No comparable completed-project or median permit-time change attributable to a particular final rule was verified.
Limit: Compare published final rules, agency permit timelines and project completions against the pre-change baseline.
Sep 26, 2026 review · Permitting Council performance reports ↗Energy abundancePartial · Mixed
August U.S. mining output rose 0.1% from July, while household energy CPI was 16.3% higher than a year earlier.
Limit: Mining includes non-energy activity, and output changes do not establish cheaper household energy.
Aug 2026 · Federal Reserve G.17 ↗ · BLS CPI ↗Trade & reciprocal tariffsPartial · Unresolved
USTR lists signed reciprocal-trade agreements and tariff actions; August U.S. manufacturing output was 0.9% above its year-earlier level. USITC DataWeb allows product-level trade-flow and tariff checks.
Limit: Signed text, tariff revenue, realized exports, import prices and net domestic output require separate series; trade shifts do not establish tariff incidence or a causal net benefit.
Sep 26 / Aug 2026 · USTR presidential tariff actions ↗ · USITC trade and tariff data ↗Industrial & defense capacityPartial · Mixed
August business-equipment output fell 0.5%, and defense-and-space equipment output fell 1.2% from July.
Limit: One month's output cannot measure production readiness, inventory or procurement delivery.
Aug 2026 · Federal Reserve G.17 ↗Investment and Buy AmericanPartial · Unresolved
BEA reports $232.2 billion of 2025 new foreign direct investment expenditures to acquire, establish or expand U.S. businesses.
Limit: Aggregate 2025 spending is not proof of 2026 Buy American compliance or specific announced project delivery.
2025, released Jun 2026 · BEA new FDI ↗Immigration & workforce policyPartial · Unresolved
August unemployment remained 4.1%, and labor-force participation was 61.6%, down 0.5 percentage point since January.
Limit: These aggregate workforce numbers cannot isolate immigration-policy effects on wages, vacancies or sectors.
Aug 2026 · BLS employment situation ↗Debt, interest & Federal Reserve interactionPartial · Rising
CBO projects a near-$1.9 trillion FY2026 deficit and rising interest costs; the independent FOMC raised its target rate to 3.75–4.00% on September 16. Treasury statements provide actual receipts and outlays for comparison.
Limit: Projected net interest is not a realized outlay, and the Fed's independent decision is not an administration action.
Feb projection / Sep 16, 2026 / Treasury monthly · CBO budget outlook ↗ · Treasury monthly statement ↗
Congressional Continuity Scenarios
Measures how House or Senate control could accelerate, amend, constrain, or reverse the agenda without treating an election outcome as proven economic damage.
House tax & spending authorityConditional · Unresolved
The House has legislative and appropriations authority; a change in party control has no single measured household price effect.
Limit: Assess enacted bill text and CBO/JCT effects for each actual vote, not a party-control scenario as an outcome.
Sep 26, 2026 review · CBO budget scoring ↗Appropriations and rescissionsEvidence gap · Unresolved
Appropriations and rescissions require congressional enactment or the statutory impoundment process; no consolidated enacted-to-outlay reconciliation was verified for this measure.
Limit: Identify each enacted appropriation or rescission, its budget score and subsequent Treasury outlays before claiming realized savings.
Sep 26, 2026 review · GAO Impoundment Control Act guide ↗Senate confirmations & treatiesConditional · Unresolved
Senate consent and confirmations are institutional mechanisms, not an independently measured economic outcome.
Limit: Identify a specific nomination or treaty, operative date and measurable economic channel before assigning direction.
Sep 26, 2026 review · U.S. Senate executive business ↗Reconciliation and vote thresholdsConditional · Unresolved
Reconciliation can alter tax and mandatory-spending law, subject to the enacted text and legislative process.
Limit: A vote threshold alone cannot be scored as economic progress; use signed law and independent budget estimates.
Sep 26, 2026 review · CBO budget scoring ↗Oversight, subpoenas & investigationsConditional · Unresolved
Oversight can uncover implementation problems, but a subpoena is neither a finding nor recovered money.
Limit: Require a published finding, remedy, audited savings and timing before measuring fiscal effect.
Sep 26, 2026 review · GAO payment integrity ↗Pending bills vs. executive authorityConditional · Unresolved
Proposed bills, executive directives and enacted statutes confer different authorities and have different economic effects.
Limit: A current bill-specific status register and scored implementation path are required; proposal does not equal law.
Sep 26, 2026 review · GovInfo legislative records ↗Unified vs. divided governmentConditional · Unresolved
Either configuration can pass, amend or block particular measures; there is no standalone observed 2026 price effect to attribute to a future election outcome.
Limit: Analyze named bills under explicit scenarios; do not forecast harm from control alone.
Sep 26, 2026 review · CBO budget scoring ↗Bill-specific family & business effectsEvidence gap · Unresolved
No single household or business effect can be inferred from a category of bills without enacted text, eligibility, effective date and budget estimate.
Limit: Build separate records for each material bill and distinguish CBO projections from observed prices and income.
Sep 26, 2026 review · GovInfo legislative records ↗
Evidence framework
Objectives, Official Measurements, and Independent Checks
Administration priorities establish what is intended. Dated measurements test what happened; independent analysis checks costs, distribution, and attribution.
Official Record & Primary Data
Administration statements document objectives and actions; BEA, BLS, Census, the Federal Reserve, Treasury, CBO, and GAO measure conditions and fiscal results. Neither alone establishes a policy's causal effect.
Detailed Outcome Datasets
Use household, local business, investment, trade, fiscal, and energy series to test whether national gains reach families and translate into operating capacity. Check each series' release date and coverage.
BLS consumer expenditures ↗Census household pulse ↗New York Fed household debt ↗BEA regional prices ↗BLS county wages & jobs ↗Census business births & closures ↗Census capital expenditures ↗BLS manufacturing productivity ↗USITC trade & tariffs ↗Treasury monthly statement ↗EIA state electricity prices ↗
Conservative Policy Case
Supportive or national-interest analysis used to frame objectives, mechanisms, and policy tests; conclusions remain subject to measurement and corroboration.
Challenge & Cross-Check
Cato supplies a contrasting libertarian test; independent data and reporting test costs, distribution, causation, implementation, and unintended effects.
Context-only sources: Study.com, Indeed, Ultima Markets, eToro, and State Street Global Advisors may clarify definitions, career or market concepts, or investor transmission. They are not used as substitutes for official national statistics, legal status, company filings, or independently verified causal evidence.
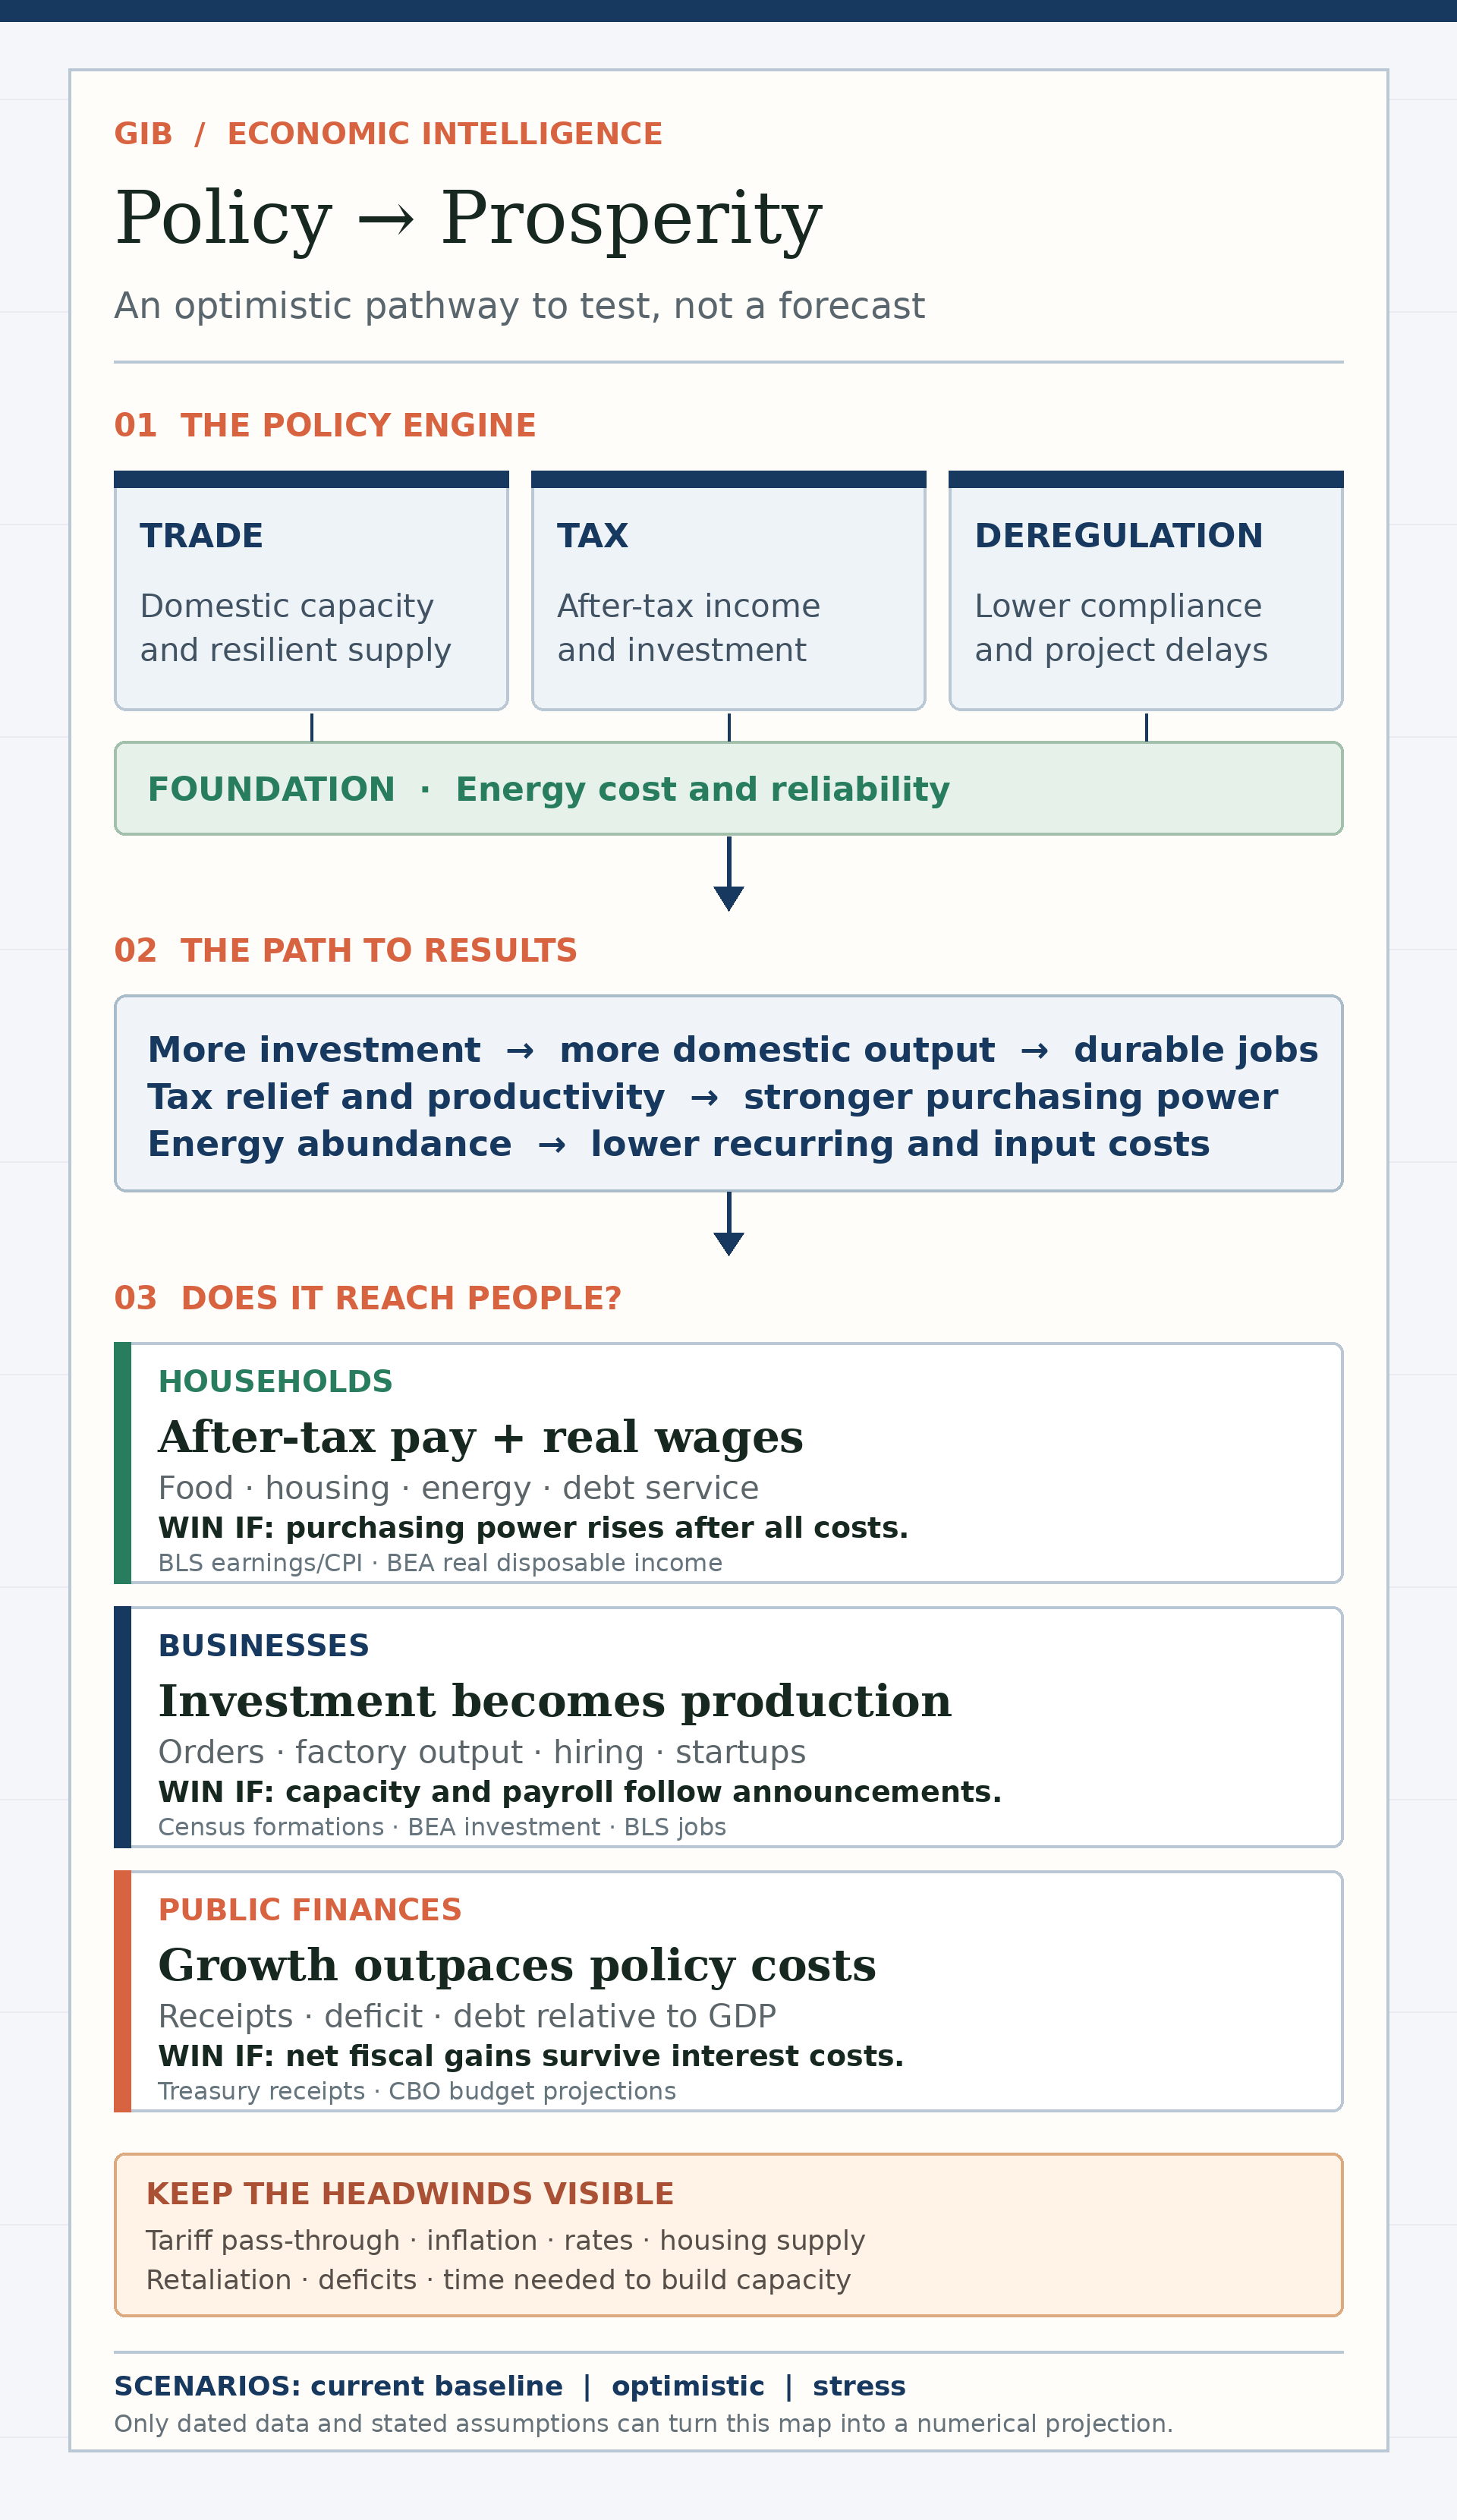
Economic scenario modelPolicy → ProsperityTrade · Tax · Deregulation → household, business and fiscal outcomes. An optimistic pathway to test, not a numerical forecast.
This graphic connects the administration’s stated policy pillars with outcomes that would matter to families, businesses and the public finances. Each result requires dated evidence; the arrows describe a conditional pathway, not demonstrated causation or a numerical prediction.
Confronting National DebtDebt Strategy, Execution, and Fiscal ConstraintsDebt, interest, defense, savings, tariffs and fiscal constraints · Cutoff unavailable
Review gross debt, public debt, the deficit, net interest, refinancing, security spending, verified savings, tariff receipts and legal constraints in the sourced investigation.
Open Government Waste, Fraud & the National Debt →